

Legacy Manual
Summary Graphs
The summary graph screen in PingPlotter Pro is a listing of any final destinations or intermediate hops from any of your destinations. This summary gives you a way to compare multiple targets, and also gives you an easy one-glance summary of all the important parts of your network.
Adding targets to the summary screen
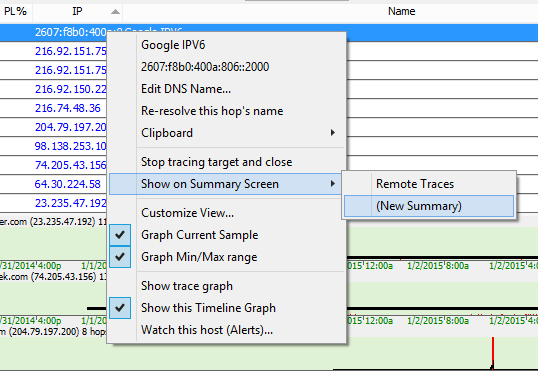
By default, when you trace to a new target, that final destination will automatically be added to the summary graph screen, and a time-graph for that summary will be added as well. In addition, if you want to manually add a target (or any intermediate hop) to the summary graph (or a custom summary graph, which we cover below), just right-click on that hop in the trace graph and select "Show on Summary Screen".
From the summary screen, you can switch to the trace graph by right-clicking on a host and selecting the menu option "Show trace graph," or by simply clicking on target's IP address. You can sort the list of targets by clicking on a graph heading. Clicking again reverses the sort order.
Creating custom summary screens
Starting with PingPlotter Pro v4, you can create multiple custom summary screens, making it easy to group certain targets together. To create a new summary screen simply right click on a target (or you can select multiple targets by holding down the "CTRL" key and clicking on them, and then right click) and under "Show on Summary Screen" select "(New Summary)" and a new tab will open up with your target(s).
You can remove targets from a summary screen by right clicking and selecting "remove from summary." You can also rename your summary by right clicking on its tab and selecting the "Rename Summary..." option
Time periods on the summary screen (or, "focus time")
The summary graph screen works slightly different than some of the other graphs in that the upper summary graph may have any number of targets, all using different collection methods and possibly different trace intervals. Because you might have different trace intervals (and even different time scales), the "Focus Time" concept is replaced by a single Focus Time on the summary screen.
Resizing the time graphs
Once you get a few targets on the summary screen (and a few time graphs), you may wish you could re-size (make them taller or shorter) the time graphs but are unable to because of the existence of the scrollbar on the time graph area.
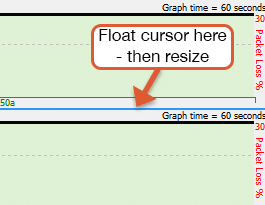
To re-size all of the time graphs, scroll to the last summary graph (the scroll bar should be at the bottom of its range). Now, float your mouse cursor between the lowest graph and the one above it, and you should get a re-size pointer and you can then size the graphs at your pleasure. All time graphs will re-size to match.
**The feature in this topic is exclusive to PingPlotter Pro. See our product comparison page for more details**