

Using PingPlotter
PingPlotter's Web Interface Takes Your Network to the Net
Our new and improved web interface expands PingPlotter's flexibility without compromising its simplicity.
The web. You can buy tacos on it. People say it’s gonna be big.
Well, we want in!
One of the most-requested PingPlotter features has been a full-featured web interface. While previous PingPlotter versions did have a functional web interface, its form and usability left a lot to be desired. In short, it worked...just not quite as well as we wanted.
Thankfully, PingPlotter’s latest update brings with it something we’ve worked to implement for quite some time: a web experience that takes the core of PingPlotter and expands it somewhere you and your team can access to analyze data at a glance, manage traces from just about anywhere, and collaborate like never before.
Even better, with a few clicks, PingPlotter’s web interface can be up and running wherever you need. Let us show you how!
Getting started with PingPlotter’s new web interface
Setup for PingPlotter’s web interface is fast and simple.
First, download the latest version of PingPlotter Professional (version 5.15 or later) from your account, our download page, or by launching PingPlotter and selecting Check for Updates… from the main menu.
To activate PingPlotter’s web interface, begin by opening the Settings menu. Under Web Server, you should see the option to Enable built-in web server.
If you’re familiar with or have previously set up PingPlotter’s web interface, you’re already good to go! You can simply refresh your browser, and the new interface should pop right up.
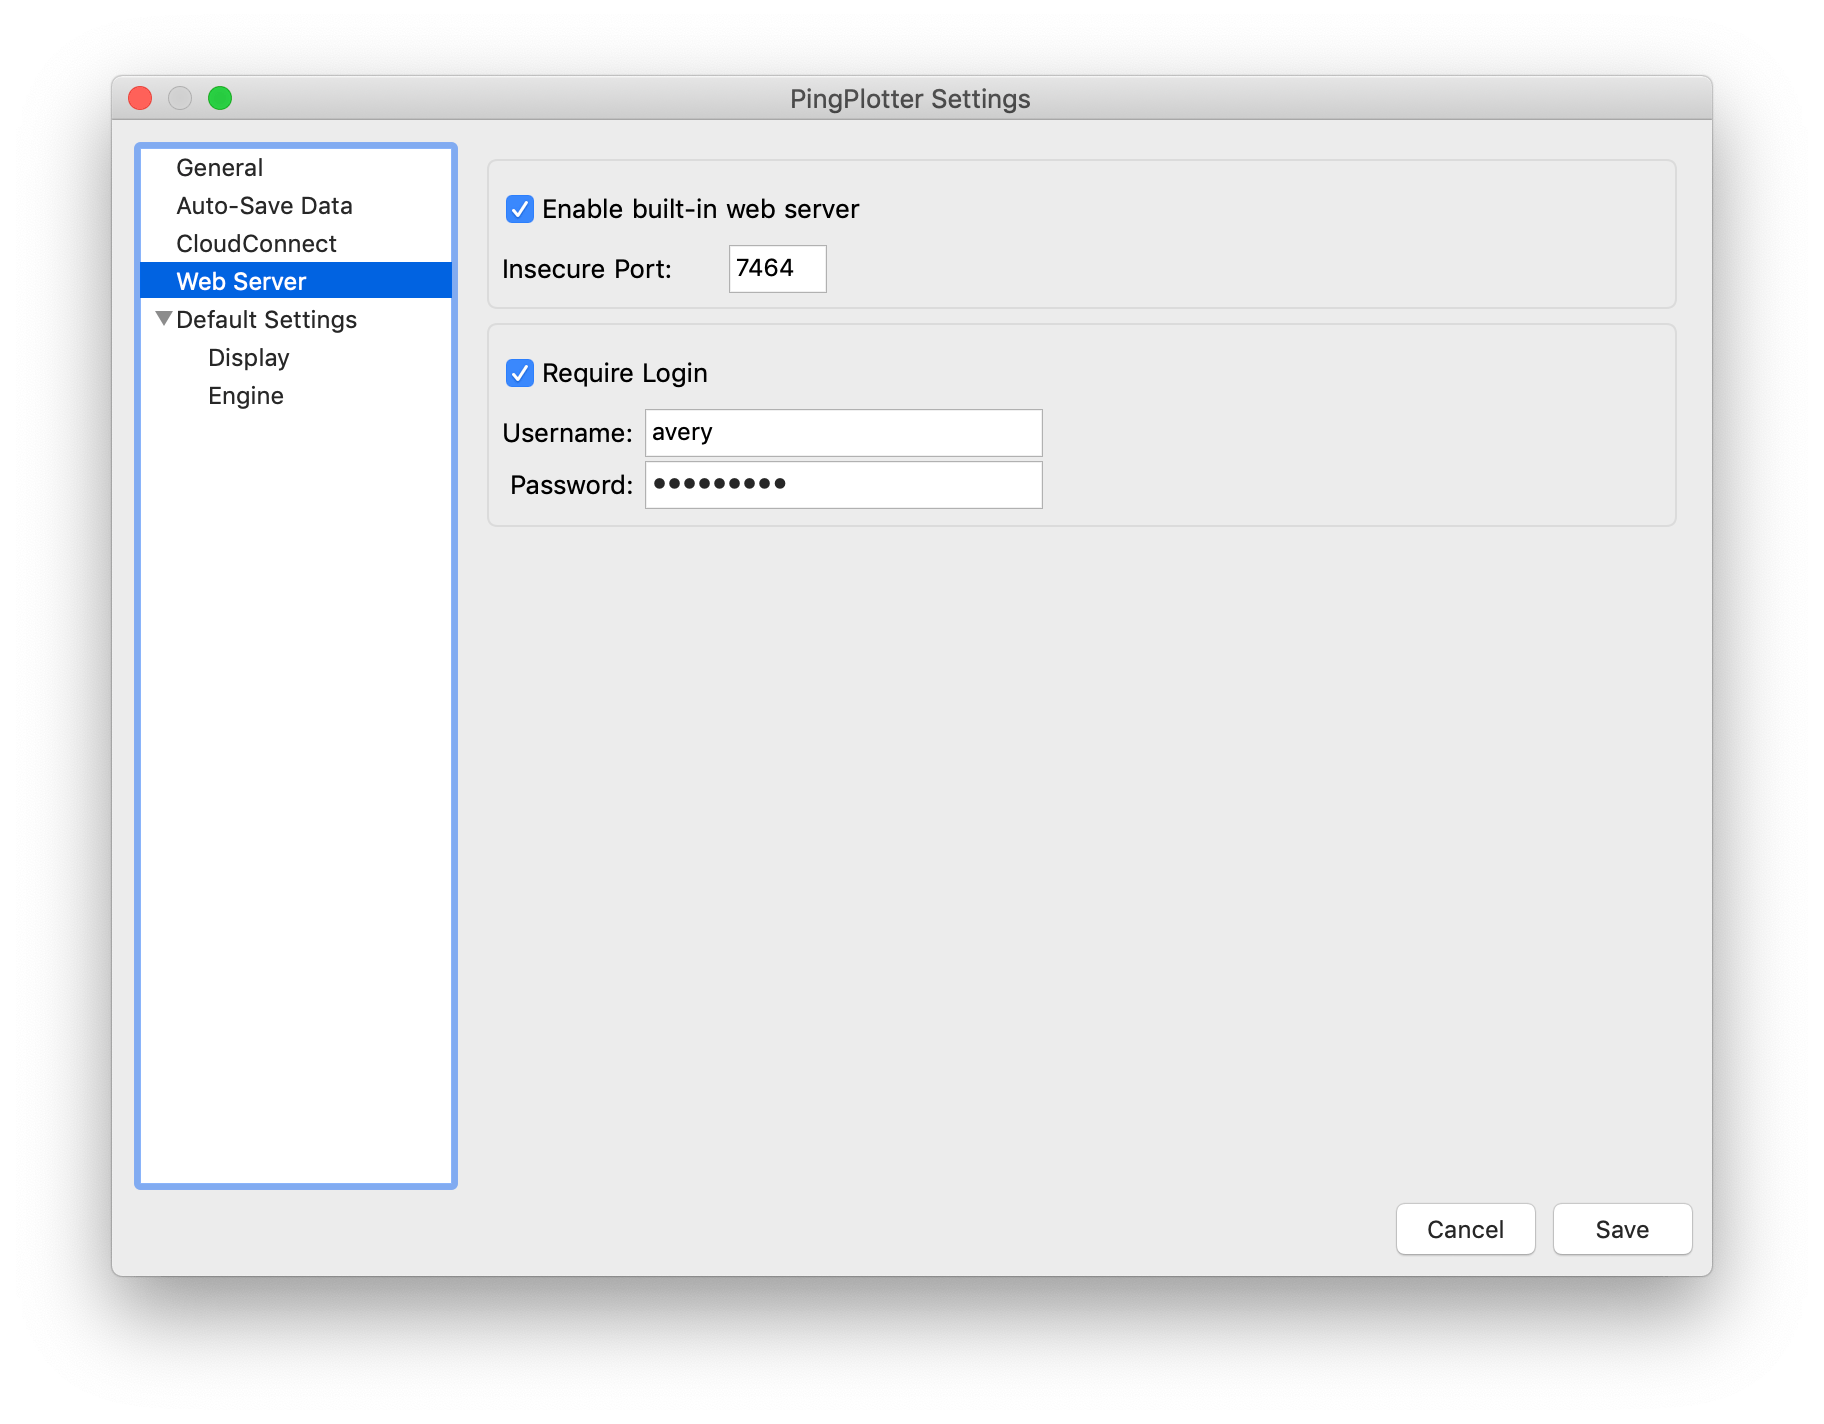
From here, you can set a port number for the local server. You can also require a login to restrict web access.
Once enabled, you can navigate to the address you set (https://localhost:7464/ by default), and ta-da! Once you’ve logged in, you’ll be greeted with your All Targets screen.

As you can see, the web interface looks a lot like the PingPlotter you already know. You can click, drag, resize, and generally interact with the web just as you would the existing client. In fact, all of your current PingPlotter sessions are already waiting for you.
Much like the client, you can right-click on any row to see all available options. You can also customize which columns are visible by clicking on the menu icon in the top-left of the target bar.
Clicking on the IP address of any target will open the full target window for that trace.

From the target window, you can start/pause/stop the trace, change targets, or adjust trace intervals and focus periods. In addition, you can double-click on any hop to open a timeline graph — just like with normal PingPlotter. You can also download your collected data directly from the interface by clicking Download .PP2.
CloudConnect is now PingPlotter Cloud.
PingPlotter Cloud does everything CloudConnect does and a whole lot more. Learn more about the change and what it means for you.
Learn MoreAll-in-all, the web interface brings the core PingPlotter functionality to a new form factor, giving you more versatility in how you collect and view diagnostic data.
The road ahead
This new interface is just the beginning of what’s planned for the near future. Since we’ve had a tendency to keep our cards close to the chest, we wanted to give you some insight into what we’re actively developing, especially when it comes to the web.
Our primary goal is getting the web interface as close to one-to-one with the PingPlotter client as possible. One of the biggest draws of the web interface is the ease-of-access for remote deployments, as software clients can be a hassle to use when remoting in from off-site. One of the best ways to use PingPlotter is to deploy it remotely, and we want to make that experience the best there is.
We still have a little ways to go with web/client parity:
- First, there are settings. Currently, engine settings (such as packet types or NIC selection), need to be set client-side. We want to have the full breadth of system options available from the web, and we’re not too far from having it ready.
- Second, we’re hard at work incorporating another core feature: alerts. While we plan to have the full toolbox implemented, PingPlotter wouldn’t be PingPlotter without its robust alert system. Making sure alerts are functioning reliably is a top priority.
Outside of parity, we have a number of features we plan to implement in the near future:
- The biggest — and most requested feature by far — is read-only support. We’ve had almost daily requests for a read-only web interface, and it’s definitely in the works.
- This pairs with another critical component on our roadmap, which is multi-user login support. It’s hard to have a read-only interface without access restrictions, and you can’t restrict access if you can’t manage users. We’re going to have a lot to say about this one in 2020, so be sure to stay connected with us.
We can’t give specifics on timeframes or timelines, but we think this glimpse into the future will help you get the most out of the web interface today while looking forward to what’s coming next.
Get a new window into the network
The new web interface gives PingPlotter another level of versatility. While PingPlotter’s client is still one of the best ways to collect and view critical diagnostic data, there are times when a client-less interface fits better into your environment or workflow.
As we continue to build new functionality into the web, we hope to expand the scope of what’s possible with PingPlotter. For as much as the landscape of software, web and SaaS applications, and networks have evolved, the fundamental network issues that plague both end-users and professionals persist. We can’t wait to share more with you about everything we’re doing to help make network troubleshooting suck less.
Do you support remote workers?
When remote workforces have connection trouble PingPlotter Cloud helps you find the problem and get everyone back online fast.