

Internet troubles? See it. Solve it.
Get visibility into every internet slowdown, dropout, and disruption.
Pinpoint the problem to find out exactly what's wrong—so you can fix issues at the source and trust your network.
for Businesses for Home Networks for Home NetworksTake control.
Collect objective network data: Catch problems before they get worse.
See clearly.
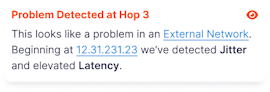
Visualize every hop between a device and an endpoint.
Understand your network.
Simplify the complex: We break down the problem so you don't have to.
Act confidently.
Zero-in on the problem, make the fix, and stop the guesswork.
Take control of your network problems.
Collect critical metrics that you (and experts) can trust. Share data with IT, ISPs, and colleagues to get to the root of the issue.

Track performance over time.
Continuously monitor network data in easy-to-read charts that provide a clear view of internet health.

Perspective changes everything.
See network metrics from a particular device’s point of view.
Set it and forget it.
PingPlotter runs continuously in the background, gathering all of the data you need to make informed decisions.
Understand what makes your network tick.
Visualize every hop between a device and an endpoint. Monitor the flow of data 24/7/365 for a complete picture of network performance.
Readable for IT pros and non-technical folks alike, PingPlotter’s diagnostics provide a window into where problems occur.

See through the noise.
Quickly visualize performance data and identify anomalies that lead to downtime.
Spend less time troubleshooting.
Armed with PingPlotter data, take action to pinpoint bottlenecks and prove to IT or your ISP where the issues are.
Show, don't tell.
Get to the heart of the problem and concentrate on solutions with PingPlotter’s insights, trusted by service providers and companies around the globe.


The data is the story.
Not a technical person? No worries. Share live PingPlotter results and let the data do the talking.

