

Remote troubleshooting for
PingPlotter Desktop lets you troubleshoot from one computer, but what if you need to monitor many locations? Enter PingPlotter Cloud. Monitor every remote connection in real-time, pinpoint issues instantly, and resolve them before they impact your users. Stay ahead of problems with PingPlotter Cloud — your eyes on the network, no matter where.

Gain insight into all of your remote connections.

Trusted worldwide by businesses large and small.
Unified network visibility across all devices.
Monitor connection performance from a centralized dashboard.

See every connection, understand every experience.
Get clear insight into what end users and remote devices are really experiencing. Collect actionable performance data over time to spot trends and optimize your remote workforce — before issues become disruptions.
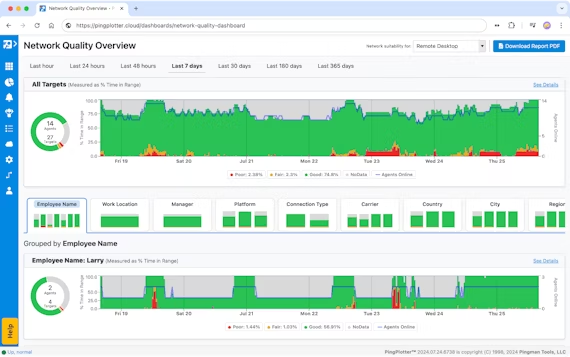
Dive into your internet data.
Unlock interactive charts and explore historical trends across your entire team. Filter by location, carrier, platform, and more to zero in on exactly what's affecting performance.
Automate the busywork.
Let PingPlotter handle the grunt work of monitoring for issues—jump in only when it’s time to troubleshoot.
Empower managers to resolve minor problems, freeing up your IT team for what really matters, and view all connection issues in one shared space—no more silos.
Hire smarter.
Validate potential employees’ remote connections with confidence. Enhance your hiring process by testing multiple candidates' network performance, ensuring reliable connectivity before making your final decision.


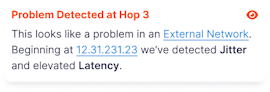
Fix issues before end users notice.
Customizable alerts help you get ahead of critical failures.
Make better decisions with real-time data.
Bridge the gap between tech and non-tech teams. Share live data to boost trust and keep everyone aligned, every step of the way.

Share live data, instantly.
Give others a front-row seat to your findings. Share specific graphs, time periods, and network insights—so everyone sees exactly what's happening with their connection.
