

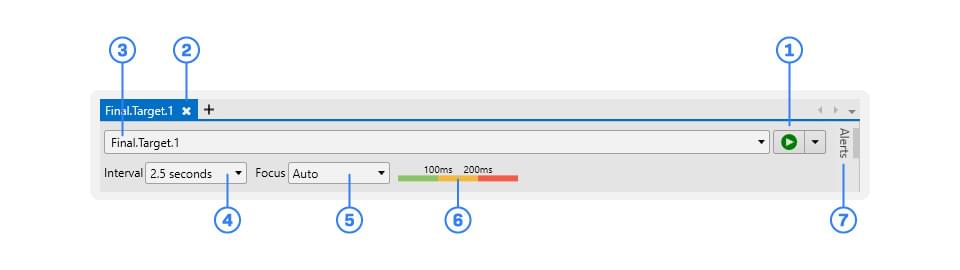
The Target Bar
The Target Bar contains settings and details used to configure PingPlotter traces.
-
Start/Pause Button
This starts a new trace (after a target has been entered) or pauses a running trace. Clicking the dropdown option on this button will let you "Reset & Restart" a trace (which begins a completely fresh trace session to that target and clears out all old trace data), as well as an option to create a "New Target" window. -
Auto-Save Icon
Denotes a trace sample set is marked for auto-saving (a checkmark) or discarding (an X) when you close the trace window. You can change this by right-clicking the icon and selecting either “Discard on close” or “Keep (auto-save).” -
Target Entry
This is where you enter the DNS name or IP address of the target you wish to trace. The dropdown will show a list of your most recent targets, as well as a few we tossed in for posterity. -
Trace Interval
Adjusts the rate at which PingPlotter sends test packets. Unless you know why you’re changing it, you should probably just leave it as-is. -
Focus Time
Sets how much data PingPlotter displays in the Trace Graph. “Auto” is a good place to start, as it displays all the data shown on the Timeline Graph. -
Graph Color Legend
This shows at which latencies PingPlotter’s graphs will display green (good), yellow (hmm), or red (hoo boy…). You can manually adjust these if you know the latency values you’d prefer. -
Alerts
Opens the Alerts tab, where you can set automated actions for a number of scenarios.