Step 2 Trace it!
You’ve got PingPlotter installed and ready, and you’ve got a good target to trace. Time to spin this puppy up!

Enter the target DNS name or IP address into the Target Entry field and hit the green Start button. You should see a flurry of activity as PingPlotter begins mapping the route from your device to the target.
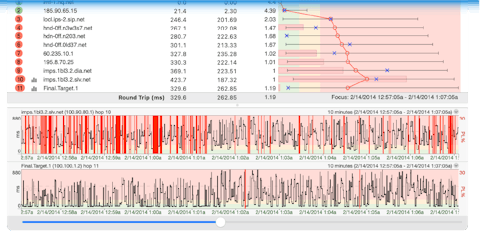
The Trace Graph will list every hop between you and your target (betcha didn’t know there were so many devices out there). The Timeline Graph will also be ticking away, capturing the juicy details of your network connection. More than likely, you’re going to notice a bunch of red, but that’s just PingPlotter letting you know the status of your connection (more on that in a sec).
That’s it! PingPlotter’s a bit like a rotisserie oven — just set it and forget it!
Once PingPlotter is humming along, you should return to the thing you were trying to do originally. This will give you a better point of reference for how PingPlotter’s results match up to the problem, which you’re going to need in just a moment.
Next, you’ll start collecting the clues you need to capture the culprit. Isn’t alliteration fun?

