Custom time graph intervals
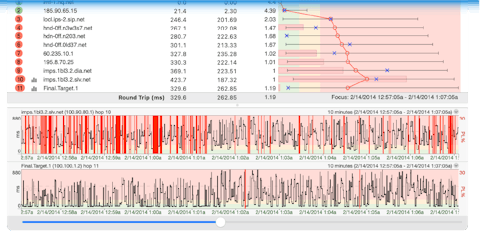
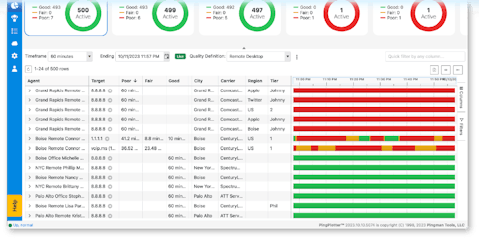
You can change, and also add, additional timeline intervals for the timeline graph if the defaults available from the right-click menu don't fit your needs. For example, you may want to look at results farther out than the default maximum value.
The default set isn't written in the .INI file, however you can add an entry and it will override the default values.
For example, if we wanted to add "2 hours" and "14 days" intervals to the right-click menu, your .INI file entry would be what you see in the example below. It's important to note that the values are in minutes. It's also important to note the "Count" value. If the value was set to "Count=12" in the example below, the value for "Interval13" wouldn't show up in the menu.
[TimeGraphIntervals]
Count=13
Interval1=1
Interval2=5
Interval3=10
Interval4=30
Interval5=60
Interval6=120
Interval7=180
Interval8=360
Interval9=720
Interval10=1440
Interval11=2880
Interval12=10080
Interval13=20160
**Some of the features listed in this topic are only available in PingPlotter Pro and/or PingPlotter Standard. See our product comparison page for more details**
-
Understanding output
- Discovering a route between you and a target
- Interpreting Results - A Quick Example
- Finding the source of the problem
- Finding the source of the problem - part 2
- Interpreting Results - Longterm Monitoring
- Interpreting Results - Gamers
- Interpreting Results - ISP Problems
- Interpreting Results - Bad Hardware
- Interpreting Results - Bandwidth Saturation
- Building a Compelling Case
- VoIP Troubleshooting Guide
Test end-user internet
PingPlotter Cloud helps solve network problems for other people.
PingPlotter CloudTest your own internet
PingPlotter Standard & Professional help solve problems on your own network.
Try PingPlotter
