How Digitell Improved Live Stream Quality with Visual Network Monitoring
How Digitell Improved Live Stream Quality with Visual Network Monitoring
When global streaming and media content company Digitell needed to improve quality of service from conference venues, they turned to PingPlotter. Using a trusted tool capable of long-term monitoring and visualization gave them the leverage they needed to demand the highest service quality for their clients' valuable broadcasts.
I've definitely had a better response sending ISPs PingPlotter data. It's a tool that puts accountability where it needs to be."
— James Newman, Director of Information Technology at Digitell
Challenge
Digitell streams conferences live on the web for their clients. Streaming from many locations across the globe is challenging because internet connection quality varies highly from location to location. To identify issues before broadcasts, Digitell evaluated network quality on location with a text-based network diagnostic tool. The tool's summary statistics identified the existence of problems but lacked information about when and where problems occurred. ISP technicians were also quick to dismiss the tool's primitive looking output.
Solution
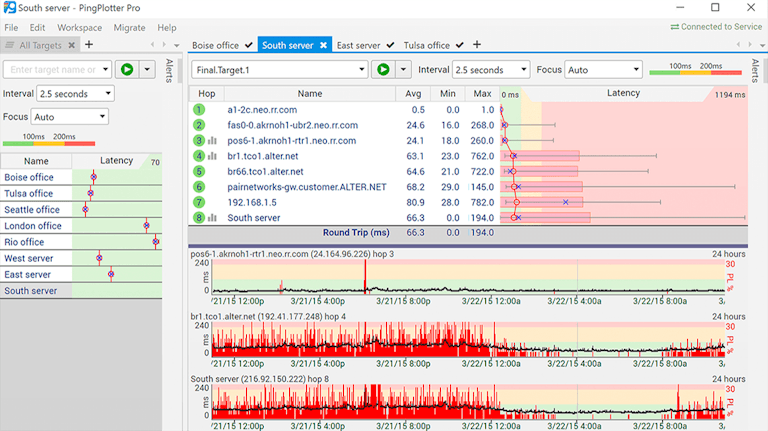
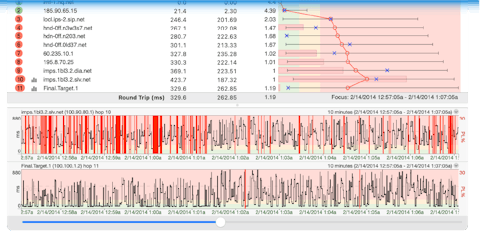
Digitell substituted the tool they were using for PingPlotter, a visual network diagnostic solution from Pingman Tools. In addition to displaying summary statistics, PingPlotter graphs network performance over time for every point along a network route. The information provided by PingPlotter improved Digitell's ability to identify potential issues before events and troubleshoot problems as they occur during broadcasts. Digitell also experienced more productive conversations with internet service providers when issues were identified outside their local network.

Confident Broadcasting
With PingPlotter constantly monitoring the network at conference sites, Digitell knows the information required to solve problems is available whenever they need it. The improved peace of mind helps Digitell focus on delivering their service instead of worrying about the possibility of unexpected network events.
Actionable Monitoring
When drops in the stream are detected, PingPlotter shows which part of the network is responsible and how long the issue lasted. The information saves Digitell time because it helps them focus on specific areas of the network instead of questioning the entire system every time issues are identified.
Better Communication
Conversations with service providers are more productive because PingPlotter helps Digitell describe specific issues. The other tool only provided enough information to know a problem happened. Many technicians have also grown to trust PingPlotter more over the tool's two decades of existence.
When we get a drop in the stream, we're able to look at PingPlotter's graph and know what part of the system is responsible."
— James Newman, Director of Information Technology at Digitell
30 License Subscription
Digitell purchased a 30 license PingPlotter Professional subscription and deployed the tool in the field and throughout their headquarters. They preferred subscription over a perpetual licensing model because they were uncertain about how many licenses they needed and wanted a cost effective way to adjust license counts.
Business Process
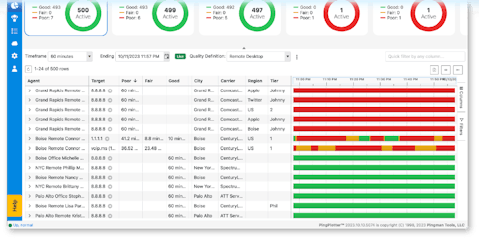
A common configuration file is shared throughout Digitell's operation. Sharing configuration lets technicians use the tool without learning the tool. They start the program and it runs to Digitell HQ's specifications. Digitell can also view live output through PingPlotter's built-in web interface.
Essential Functionality
- Network performance visualization
- Unlimited targets
- Runs as background service
- Unlimited timeline
- Alerts for latency & packet loss
- Web interface for live remote access

