

Version 5 Manual
Summary Graphs
The summary graph screen in PingPlotter is a listing of any final destinations or intermediate hops from any of your destinations. This summary gives you a way to compare multiple targets, and also gives you an easy one-glance summary of all the important parts of your network.
The "All Targets" summary
The All Targets summary is a special summary. It's all the final destinations you're tracing / monitoring. This summary is automatically maintained by PingPlotter - when you add a target it shows up, when you close, it's removed. You can rename the tab (and any other summary) by right-clicking on its tab, but it's always maintained. If you hide, it'll be there (in the Workspace menu) when you're ready for it again.
Adding targets to the summary screen
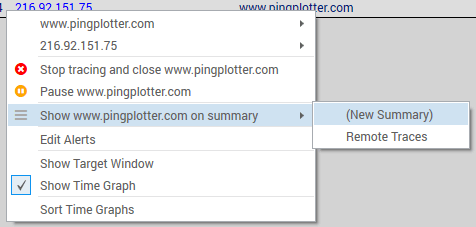
If you want to manually add a target (or any intermediate hop) to a custom summary graph (which we cover below), just right-click on that hop in the trace graph and select "Show (target) on summary" -> (then pick a summary).
From the summary screen, you can switch to the trace graph by right-clicking on a host and selecting the menu option "Show trace graph," or by simply clicking on target's IP address. You can sort the list of targets by clicking on a graph heading. Clicking again reverses the sort order.
Creating custom summary screens
You can create multiple custom summary screens, making it easy to group certain targets together. To create a new summary screen simply right click on a target (or you can select multiple targets by holding down either the "CTRL" key (on Windows) or the Command key (on Mac), and clicking on them, and then right click) and under "Show on Summary Screen" select "(New Summary)" and a new tab will open up with your target(s).
You can remove targets from a summary screen by right clicking and selecting "remove from summary."
Summary screens that have been hidden can always be reopened by going to the "Workspace" -> "Summaries" menu option - which will display a list of any active summary screens that are set up. If you want to auto-maintain a summary screen based on performance, you can use an alert to add or remove from a summary.
Time periods on the summary screen (or, "Focus")
A summary screen is a collection of targets, possibly with different trace intervals, latencies ranges or problem / performance characteristics. The "Focus" always applies the same time period to all targets, even if the trace interval is different. Some targets may be paused while others are running - they're all compared at the same time, so your statistics may be blank for some targets, and your "Count" column may have different numbers for each target.
As in the Trace window, the "Auto" focus mode is pretty awesome - you can scroll through time and get a quick summary of what you're looking at.
Using the Target Bar on a summary screen.
A great way to enter new targets is to do it from a summary screen. When you do this, the settings and interval from the summary target bar is used - and that target is automatically added to that summary screen. When you do this, a target tab is not opened for each target you're adding, but the data is being collected. Just click on the blue IP address link to open up the full trace graph.
Another cool thing about the target bar is you can easily change interval or settings - just select a target (or 10 via multiselect) and then change the setting.
On a related note, multi-selected targets have a variety of options available on the right-click menu, too. You can close, start, stop. etc all the listed targets; the right-click menu will show you the affect you're going to have.
**The feature in this topic is exclusive to PingPlotter Pro. See our product comparison page for more details**