Version 5 Manual
Edit Menu

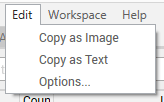
- Copy as Image - Copy the current graph to the clipboard as an image. From here, you can paste the image into your favorite graphics program or an email.
- Copy as Text - Copy the current graph to the clipboard as text. Hold down the shift key when clicking the Edit menu to toggle between copying all the collected data details, or copying a summary.
- Options... - Go to the configuration and options setup area (note: on Mac, the "options" can be found under "PingPlotter" -> "Preferences")
**Some of the features listed in this topic are only available in PingPlotter Pro and/or PingPlotter Standard. See our product comparison page for more details**
-
Common tasks
- Variable Substitution
- Auto-Saving of Data
- Running as a service
- Handling Multiple Targets
- Named Configurations
- Reporting
- Session Manager
- Local Network Discovery (LND)
- Exporting data for further analysis
- Route Changes
- Dynamic DNS Tracking
- Backing up PingPlotter Data
- Sharing PingPlotter data with others
-
Understanding output
- Discovering a route between you and a target
- Interpreting Results - A Quick Example
- Finding the source of the problem
- Finding the source of the problem - part 2
- Interpreting Results - Longterm Monitoring
- Interpreting Results - Gamers
- Interpreting ISP Problems | PingPlotter
- Interpreting Results - Bad Hardware
- Interpreting Results - Bandwidth Saturation
- Building a Compelling Case
- VoIP Troubleshooting Guide
Test end-user internet
PingPlotter Cloud helps solve network problems for other people.
PingPlotter CloudNeed an earlier version?
Versions one through four are available in the legacy manual.
Legacy Manual
