PingPlotter Cloud Manual
Agent Management
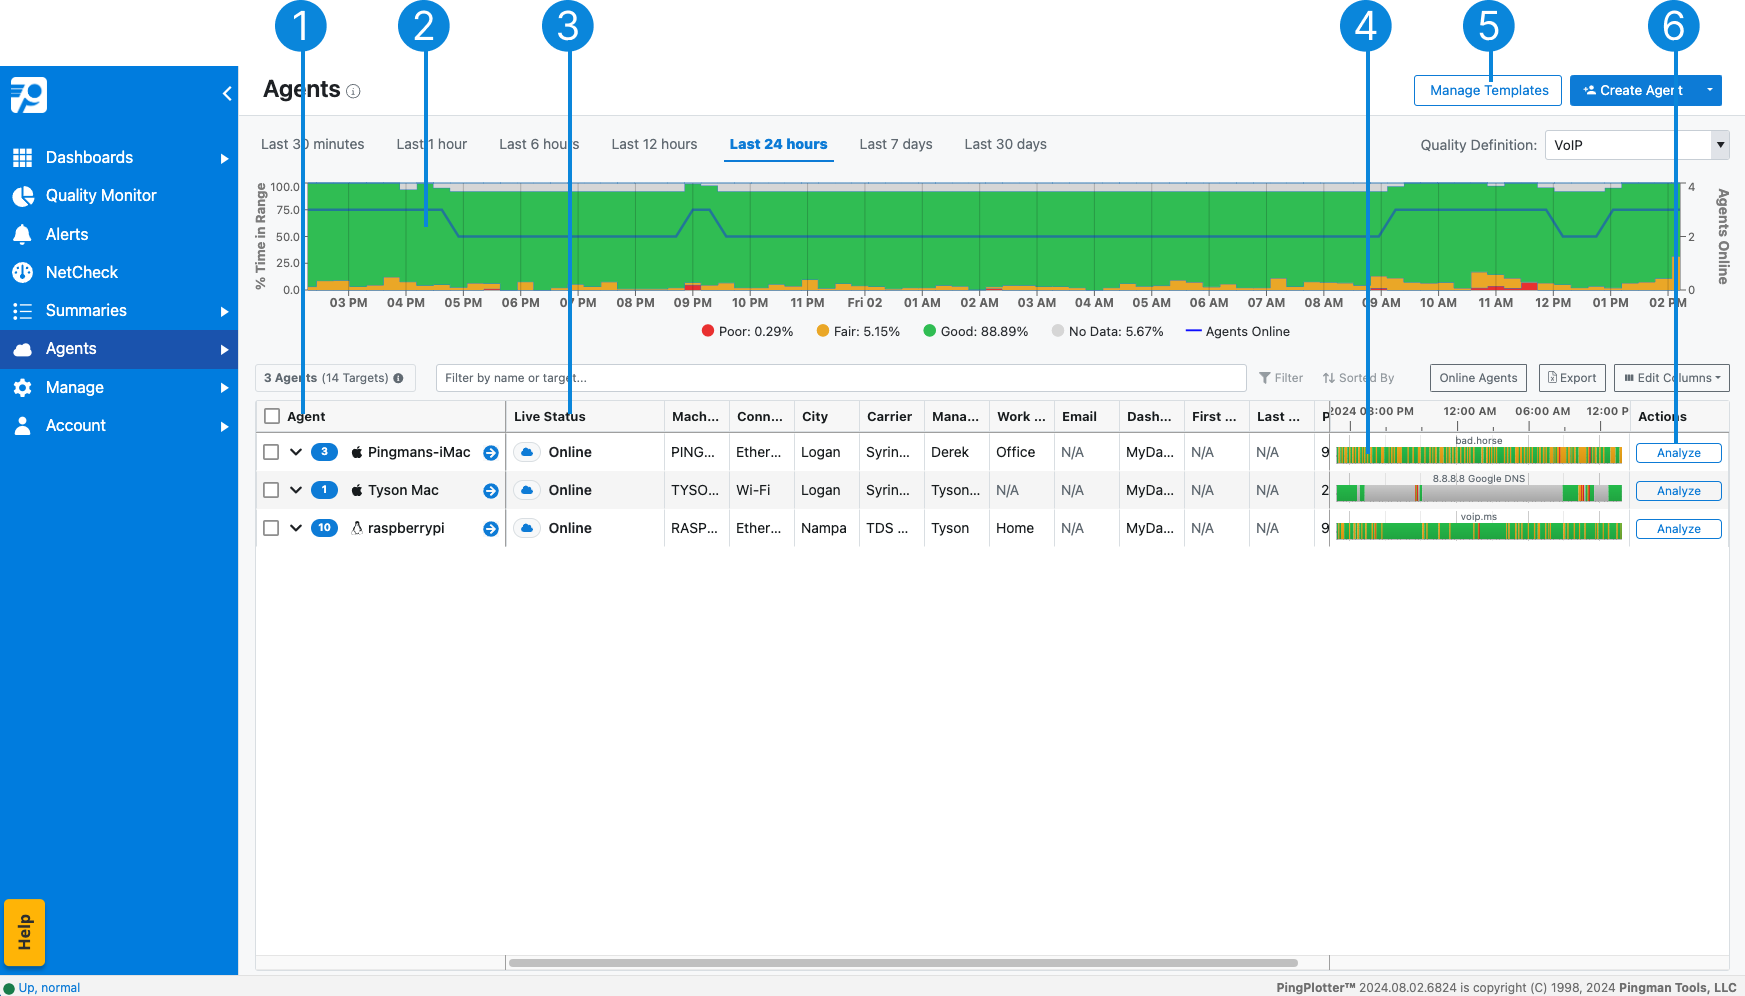
Under the Agents tab in the sidebar, you will find a list of every deployed Agent. This includes the ones deployed using a template. Here you can sort Agents and see how many are deployed or pending, along with their installation type and a list of their active trace sessions.

Agent
displays the name of the Agent, its operating system, and the number of Targets on the Agent. Click on the dropdown to view all Targets. Check the box to manage the Agent.Quality Map
aggregate quality data over time for each Agent and its Targets. Click to select a focus period. Adjust the focus period using the sliders on the left and right.Live Status
the current status of the Agent (Online, Offline, Pending) or Target (Active, Paused).Quality Bar
displays the quality of the Agents connection for the selected time frame (Red = Poor, Yellow = Fair, Green = Good, Grey = No Data). The timeframe of this graph is synced to the timeframe of the Quality Map.Manage Templates
Agent templates and presets allow you to create Agent configurations for repeated use or mass deployment. Instead of creating a new agent for each user, you can create one link that everyone can use.Analyze
use Insights to identify what may be contributing to any Fair (yellow) or Poor (red) connection quality.
Finding Issues
The Quality Map is going to be your best friend when looking for issues.
- Adjust the time frame until you see red or yellow on the Quality Map.
- Click on an area of interest. Adjust the area using the sliders as needed.
- Use the table below to identify which Agents contributed to the poor/fair quality during the selected timeframe.
- Click Analyze to drilldown on an Agent and see what caused their poor/fair quality.
Troubleshooting an Agent
The best way to troubleshoot an Agent's connection is by correlating real-world experiences with PingPlotter data. It's best to start with a specific incident (date/time) in mind.
- Use the quick filter to find your Agent.
- Adjust the timeframe as needed.
- Look for any red or yellow during the incident's reported time.
- Click Analyze to drilldown on an Agent and see what caused their poor/fair quality.

