PingPlotter Cloud Manual
Network Quality Overview
Overview

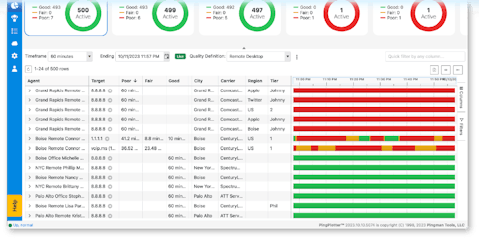
The Network Quality Dashboard give you a quick overview of your aggregated network data over time. This allows you to identify trends in quality and spot issues quickly for a specific group of Agents.
- Use the time selector at the top to adjust the total time visible in the graphs.
- Single-click on the graph to set a focus period.
- Use the sliders on the left and right-sides of the focus period to adjust its size.
- Click and drag the focus period to scrub through the data.
- Click on See Details to drill into the data on the Quality Monitor page.
Groupings

Each tab below the All Targets section is a grouping of your Agents and Targets. Use Custom Fields to create custom groupings, e.g. Manager, Department, etc.
Set your default grouping by clicking on the Star within the tab.
Download a PDF Report

Click the Download Report PDF to generate a PDF report of the Network Quality Overview. The All Targets section and your currently selected grouping will be included in the report.
Weekly Report
Want a weekly email with this report? Contact us at support@pingman.com and we'll get you added to the list!

