PingPlotter Cloud Manual
Summary View
-
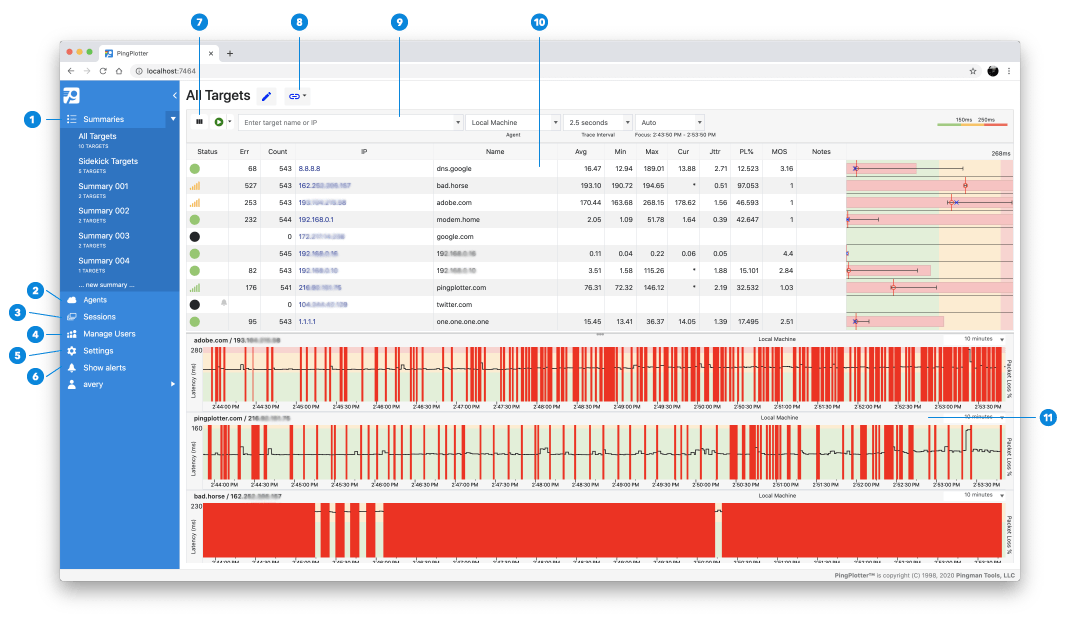
Summaries
View and manage your summary groups. Create new summaries by clicking "+ New Summary..." -
Agents
Create, deploy and manage PingPlotter Cloud Agents -
Session
View all current and previous traces -
Manage users
Add users and configure permissions -
Settings
Configure general and packet engine settings -
Toggle alerts
Show / hide the alerts sidebar for managing alert actions -
Change columns
Customize visible data columns -
LiveShare
Generate read-only links to share summaries -
Target bar
Control and configure traces to IP addresses or hostnames -
Name column
Shows DNS names or custom target names -
Timeline graph
View performance over time. Double-click a Status Light to add a timeline graph
Note
If your administrator has created a PingPlotter Cloud user account on your behalf, you may not see every menu option depending on your user profile permissions. If you cannot access a specific menu option or element, contact your administrator and request access.
Summaries are a way of grouping trace sessions together to better organize your workspace. For instance, you could create a summary for trace sessions coming out of the LA office and another for the Seattle office.
Your All Targets summary contains all of your active or paused trace sessions - think of it as your "master summary". It lists every target across every summary you have in PingPlotter Cloud.
- To create a new summary, select the Summaries tab in the sidebar and choose + New Summary...
- Start a trace session by choosing your Agent from the dropdown list, then enter your target IP, URL, or DNS name
- To show a target on another summary, use the dropdown arrow in the trace row's Status cell and select Show on Summary → [summary name]
Quick tip
The Summary View has menu options available using a right-click, with the exception of the IP cells.


