

PingPlotter Cloud Manual
Target View
-
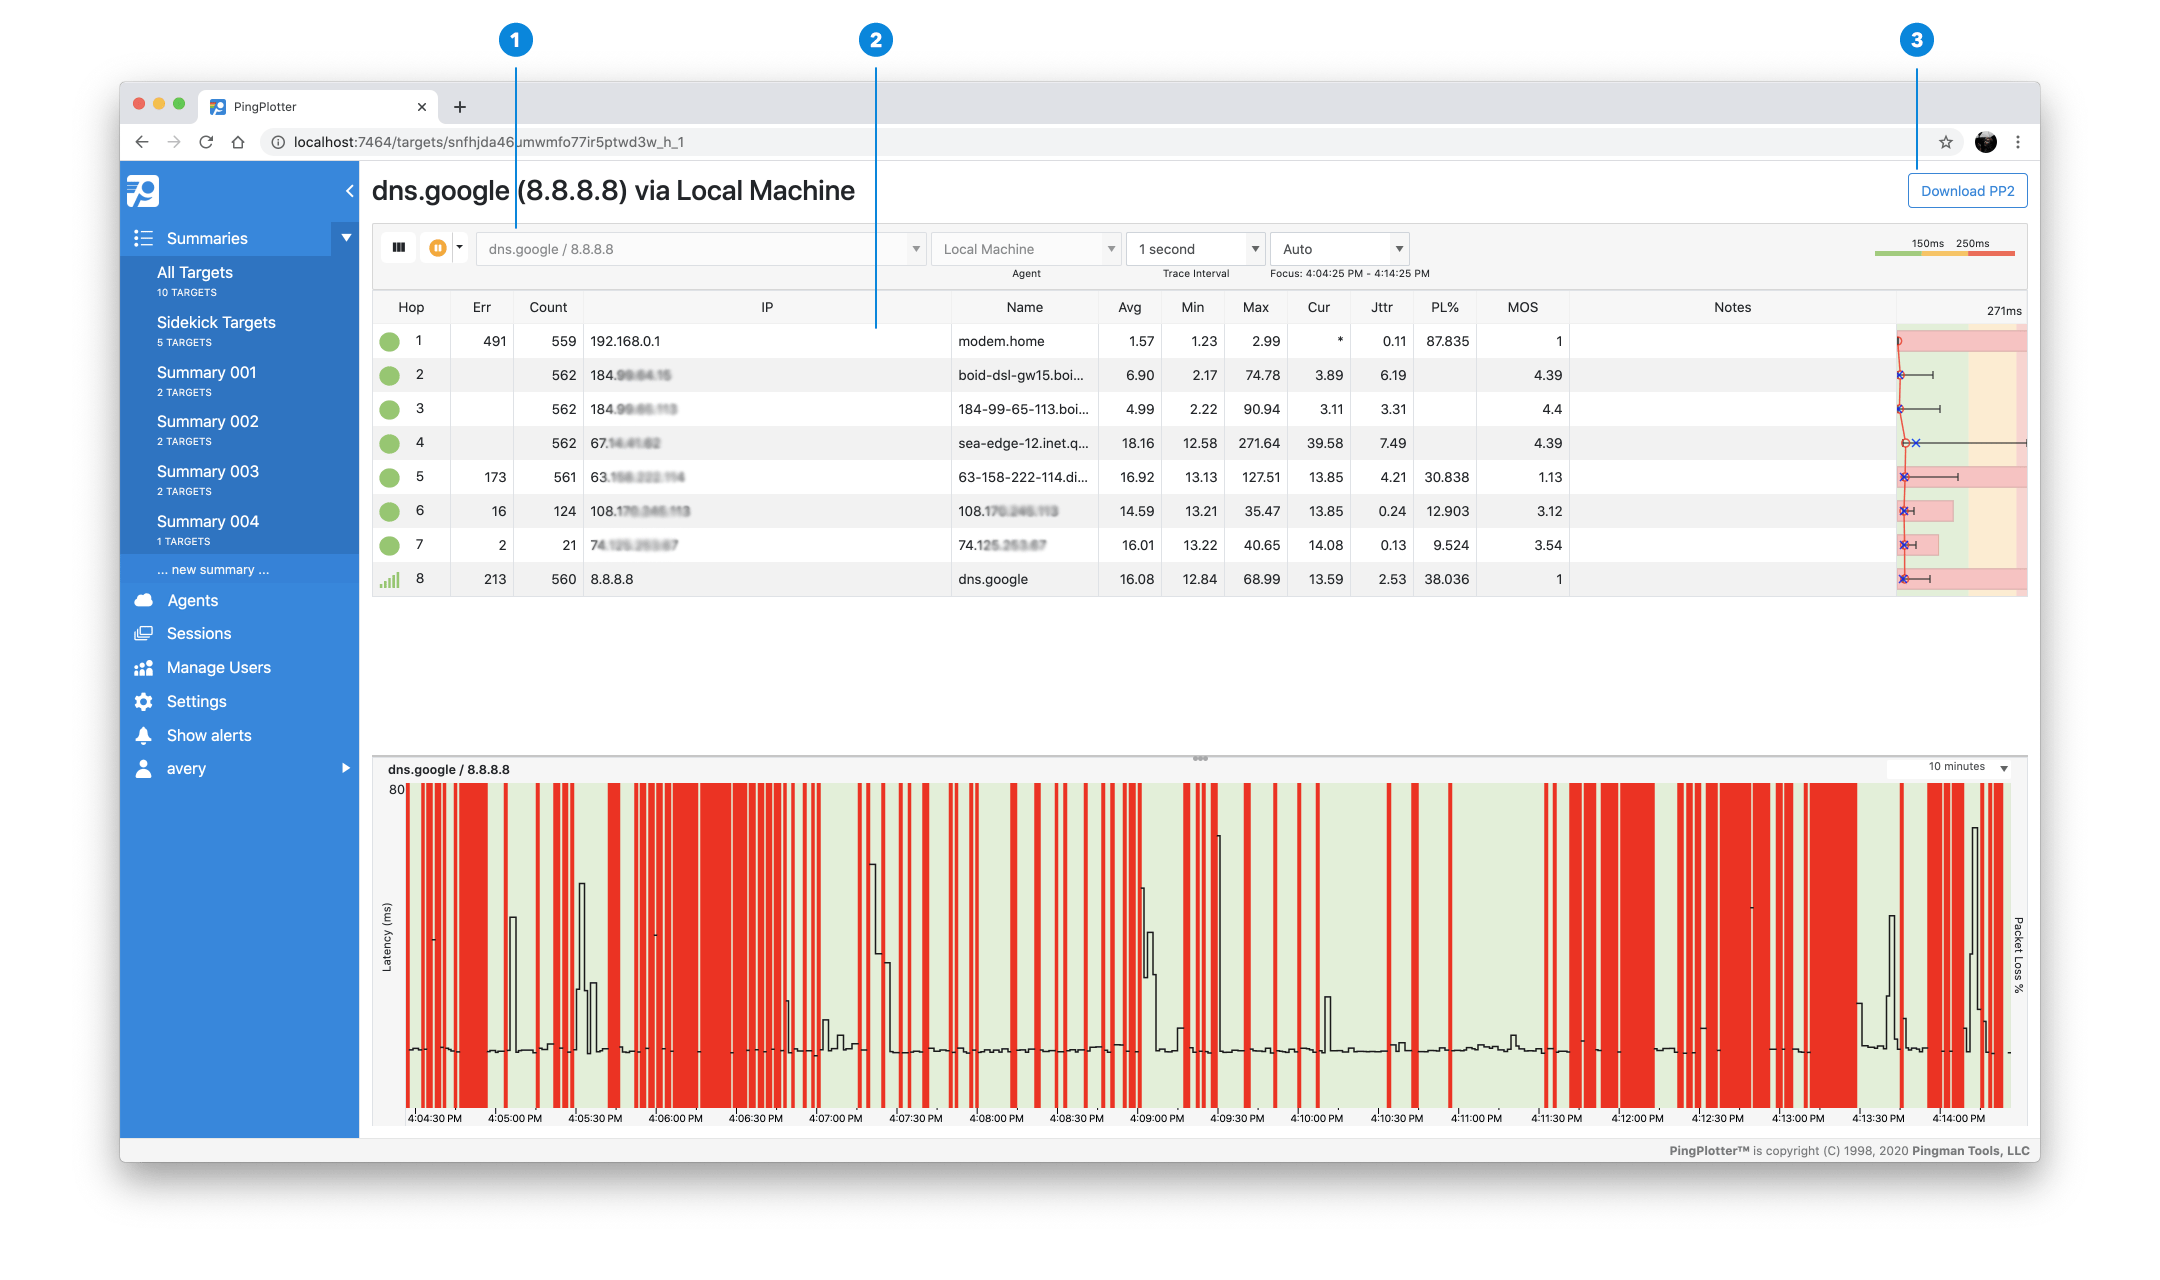
Target Bar
Denotes the trace target, Agent name, trace frequency, and focus period. Also contains trace controls and column enablement. -
Trace Graph
A list of every hop and their IP address between the device conducting a trace and the targeted endpoint. Displays collected data within the timeframe in Focus. -
Download PP2
Download a .PP2 file containing the history of this trace, which can be shared with others and can be imported for viewing with the PingPlotter desktop application.
Starting a trace
- Select the summary to which you wish to add a trace. By default, you will have the All Targets summary to start with
- Choose an Agent you wish to start the trace from in the Agent dropdown menu
- Type the IP address, URL, or DNS name of the server you wish to trace to
- Hit Enter or click the green Start button to begin the trace
Clicking on the blue IP address of the new trace will open it in the Trace View, showing each hop in the route between the Agent and the target.
Note
The Trace View has menu options available using a right-click, with the exception of the IP cells.