

Using PingPlotter
PingPlotter Cloud’s New Dashboard — Widgets that Work
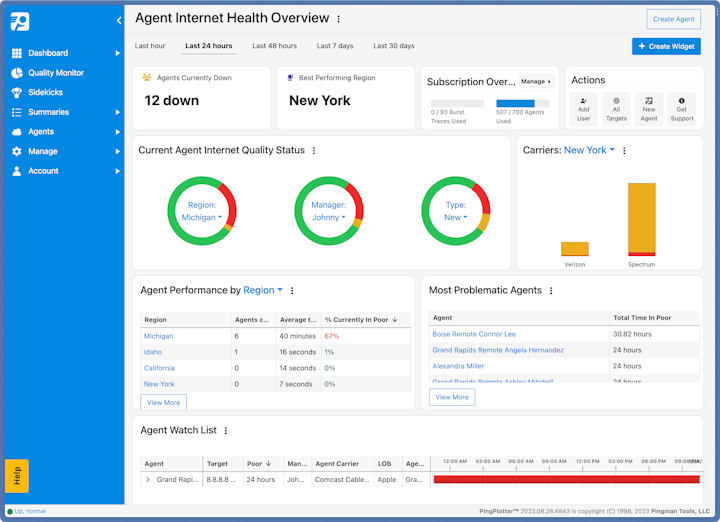
Our dashboard has always helped you keep an eye on what matters most. Now, PingPlotter Cloud’s new dashboard ups the ante with customizable widgets and data display options — so you can monitor large networks and remote workforces effortlessly.
Want to see how the contact center night shift is doing? Great. Keeping an eye on Karen's Sales team in Seattle? Perfect. Checking on those Agents that use a different ISP? Do it! The new dashboard lets you customize your widgets to get the info you need fast. You’ll spend less time digging for the problem and be able to spot recurring network issues over time.
Getting Jiggy Wid-get
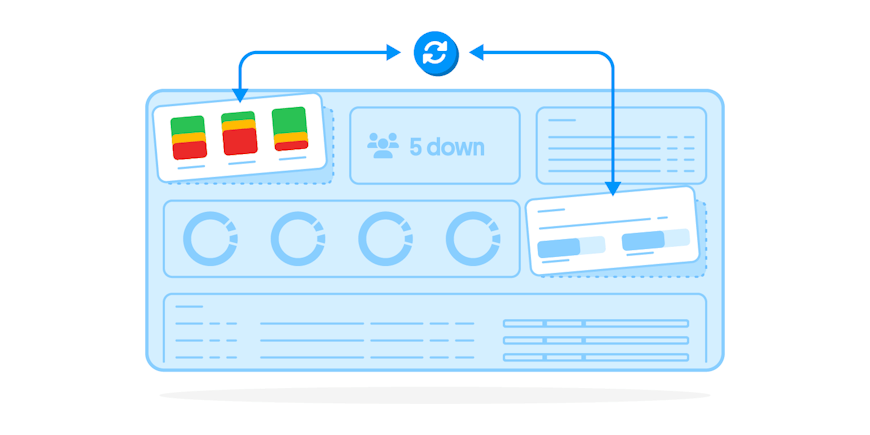
One of the best features about the new Cloud dashboard is that you can customize your widgets any way you like. Widgets can be duplicated, moved around and resized. And you can filter data by time (ie: the last 24 hours), region (city, state), and carrier (ISP). An extra bonus: Region and carrier filters tell you what area of the country has the best internet quality, so your company can focus their remote-worker hiring there.
There are two groups of dashboard widgets: data and overview. Some of the data widgets allow you to jump straight to Quality Monitor for more troubleshooting info. Learn how to do this in our manual.
Data Widgets
- Donuts: See groups of Agents by a specific filter and quickly jump to Quality Monitor view for more details.
- Bar Graph: Group and filter data here.
- Pivot Table: A tabular view of a group.
- Detailed Quality Table: Track Quality Monitor data in a Watch List. Allows you to select which data is tracked.
- Condensed Quality Table: A tabular view showing the Agents with the poorest internet performance.
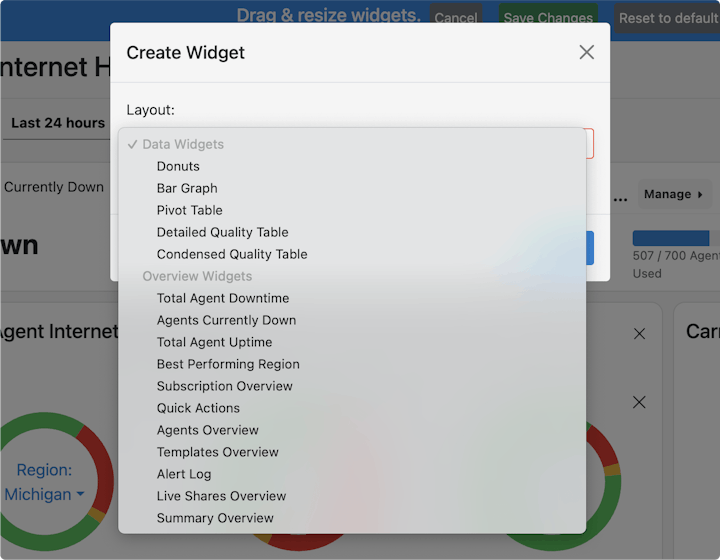
Access every widget from the same place.
Overview Widgets
- Agents Currently Down: Agents experiencing poor quality now.
- Total Agent Uptime: Time spent in good quality for all Agents.
- Best Performing Region: The highest quality internet connections.
- Subscription Overview: The number of Agents and traces.
- Quick Actions: Buttons to add users, view all Targets, create an Agent and get Support.
- Agents Overview: All Agents and their status (offline, online, idle).
- Templates Overview: A list of your Agent templates.
- Alert Log: Keeps track of an alert fired with buttons to go to the Target or Agent.
- LiveShares Overview: All LiveShare reports and their status.
- Summary Overview; Where to find your customized summaries.
Work, Work, Work, Work, Work, Work
Someone on Karen’s Sales team is having some major internet problems. The Detailed Quality Table widget (with Quality Monitor view) lets you quickly see what remote workers require immediate troubleshooting. You can also set up an Agent Watch List on this widget, so you can check up on those repeat offenders and not have to navigate back and forth.
Made-To-Order
You can change the look of your new PingPlotter Cloud dashboard anytime you feel the urge. Just click on the “Edit” button in the upper righthand corner. Enjoy.
Customize it further!
The new PingPlotter Cloud API is also available! It will help you manage your end-users and customize your Agent automation. Contact our support team today for a special preview.
Do you support remote workers?
When remote workforces have connection trouble PingPlotter Cloud helps you find the problem and get everyone back online fast.