Cut Through Confusion With PingPlotter Reports

Your mastery of IT Kung-Fu can leave others scratching their head. Reports help you bring the power of PingPlotter to anyone you need in a form that’s easy to understand.
“Uh-oh. It’s happening again.”
You’ve seen it a million times before. The eyes. The yawn. The glance at the cell phone. You did your best this time. Tried to make it interesting, make it easy, but it was over the second you pulled out the spreadsheets.
You lost ‘em.
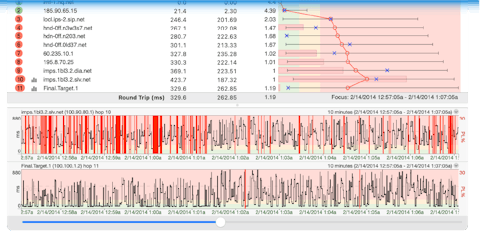
A stable, working network is important to just about everyone these days. Yet, the moment you try to explain to someone why their connection is slow, they hop the first rocket to Space-Out City. Even when it comes to other pros, a giant log file or batch of screenshots is an invitation to glaze over. It’s not your fault. Complex data tables are tiresome to parse. Making a slick graph or chart can get the point across, but you’d need to dedicate time better spent doing just about anything else.
PingPlotter is already a fantastic tool for quickly testing and monitoring your networks. However, what PingPlotter makes easy to understand for you may still fly right over someone else’s head. PingPlotter’s new reports function helps bridge the gap between your phenomenal cosmic IT powers and your audience’s befuddled stare. Reports are the perfect combination of depth and simplicity. Reports summarize your data in a form that’s easy to read without dumbing down the content. Every report is generated to your specs and ready for you the moment you need.
Reports for Every Mood
A report is only as useful as the stuff it covers. Luckily, PingPlotter reports are as flexible as you need. Whether it’s a by-the-second rundown of your connection or a specific comparison of two time periods, there is a report with all the info you’re looking for.
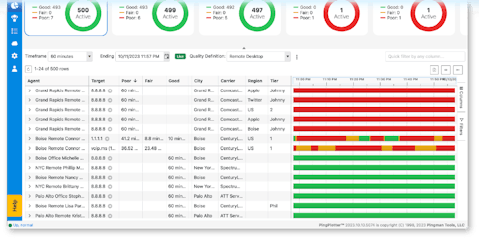
Many times, you just want an overview of how your network is faring. Summary reports take all the awesome data you’ve collected and condenses it into one tasty morsel. Summaries are the perfect tool for reviewing long test sessions. Information like your average latency or packet loss percentage is front and center, making it easy to show your boss how your office network is holding up.
When you’re tracking specific issues, such as a problem route or severe latency, alert reports are your go-to. Just like any of PingPlotter’s other alert functions, reports can be generated whenever a specific trigger occurs. Not only will you never be blindsided when a problem rears it’s head, but you’ll have the tools ready to communicate the issue to clients and colleagues.
If summary reports are a broad overview and alert reports are a focused snapshot, time period reports sit in the middle. By designating multiple timeframes for direct comparison, you can easily see how your network is impacted by changes in route or time of day. You can make adjustments while troubleshooting and directly compare the results. You’ll never need to worry about screencapping days or weeks of data to narrow down if replacing your router made a difference to your connection speed. Time period reports get you the info that’s just right for your situation. Eat your heart out, Goldilocks.
Set It and Forget It
One report can help explain a single connection test, but what about keeping your boss updated on their ongoing network status? PingPlotter has you covered. Automated reports let you schedule and share your reports at any time you choose. Select a report type, narrow down a schedule, and PingPlotter will take care of the rest. Your report will be saved as a PDF for easy sharing.
But wait! There’s more!
Automated reports are so easy to share, they actually share themselves. In addition to scheduling, you can set email addresses for PingPlotter to send reports the instant they’re made. Your network status updates will be ready and waiting in your team’s inbox without the need to tediously attach file after file.
PingPlotter Reports: Check Up Without the Check-Out
You can’t always make a colleage jump for joy the second you start talking about their network trouble. However, you can do a lot to share the info they need without watching their brain slip out the back door. Reports help you bring the power of PingPlotter to your clients in a way they can understand at a glance. It doesn’t matter if you’re trying to summarize the state of a network or explain a single issue. PingPlotter reports keep your traceroute talk short and sweet.

