

Using PingPlotter
How to Manage a Contact Center Team Using PingPlotter
When you manage a contact center team, you need to make sure that a remote agent’s home internet is working properly before you put them into the call queue. PingPlotter’s Quality Monitor lets you see the connection quality for hundreds of remote agents on a single dashboard — so you can manage your team more efficiently and elevate customer experience.
It Has Eyes

First, log into PingPlotter and pull up your team in Quality Monitor. (Hopefully, you’ve already created a custom field with your team name. If not, learn how to add a new custom field here.) Then, select the current time frame.
Agents with bad internet connections will automatically sort to the top. Use the colored bars as visual cues on who to investigate further. Green: All good right now. Yellow: Everything is fair. Red: This is poor and needs immediate attention. Click on the red colored bar and press on the blue, drop-down box to view Insights, PingPlotter’s troubleshooting assistant.
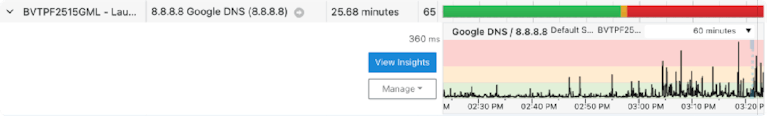
Insights automatically detects potential problems, ranks them in order of severity, and suggests how to resolve them. In the event card, you will see the location of the issue and how long it lasted.
Now, look at the Signal Quality Summary. Is the bar mostly red? If so, there was a major disruption to the network and the agent experienced downtime. It would be wise to take this remote agent out of the call queue because problems are likely to happen again until their internet is fixed. Let that call go to an agent that has a better chance of connecting with customers.
Take Out the Bad Guys
Now that your call team with the best internet connections are set up for your shift, you can dive into those remote agents with network issues.
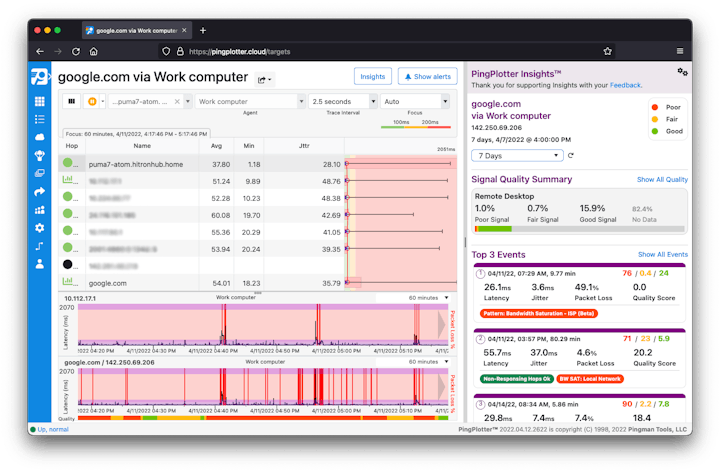
This view shows all of the hops along the traceroute. Here, you can see the connection’s performance over a 24-hour period, along with signal quality, and the top three most significant events that occurred.
Along with determining signal quality, Insights will find three most significant events. These are shown as event cards and highlighted in purple on the timeline graph. In each event card you'll find:
- Date, time and duration of the event.
- Quality score percentages during the event.
- Average latency, packet loss, jitter, and the mean opinion score (MOS).
- Possible culprits, such as local bandwidth saturation.
To get more details and suggestions on how to solve the issue, click on the event card.
The Brilliant LiveShare Feature
One of the PingPlotter features that contact centers use on a daily basis is LiveShare. This lets you generate a customized trace results page, add comments, and then send it to whoever is responsible for resolving the issue (ie: your IT team, remote agents, upper management). Anyone with the URL can view it and you can embed it into a web page.
LiveShare also enables end-users to monitor the performance of their own internet connection — and gives the ISP proof that their network is possibly to blame. (Sometimes, certain carriers don’t provide a suitable connection for your services. This may lead you to revisit which carriers your remote agents are allowed to use.) The LiveShare links will help you keep a log of those remote agent connections that have recurring problems.
Wait, There's More
PingPlotter’s Quality Monitor lets you spot network patterns over time as well. You can zoom in on a certain group of remote agents or an individual. From there, you can view data for the last hour, last day, last week, last month, or last year. You may find that the issue is local and a simple fix that you or the remote agent can do by yourselves (like rebooting). Here are some troubleshooting tips for local issues.
PingPlotter will show you which remote agents have a good internet connection and are ready to take calls — and those who are not. It will pinpoint where and when any problems occurred and provide you with potential solutions. Plus, you’ll have a record of these issues so you manage your contact center team better and avoid future downtime.
See how PingPlotter Cloud works in your contact center with our FREE 7-day trial! Our team can help you with deployment, interpreting PingPlotter results, and purchasing options.
Do you support remote workers?
When remote workforces have connection trouble PingPlotter Cloud helps you find the problem and get everyone back online fast.