What Are Good Latency & Ping Speeds?

Latency? Packet loss? You might know the numbers, but what are they showing you? Here's how to tell if your internet connection's ok.
“It's either good, or it isn't.”
It would be nice if network connections were so simple. While you may feel like things aren't quite right, feelings aren't a great way to measure network quality. To find a problem or get someone else to take action (like an ISP), you need hard data.
The best network tools test a number of metrics you can use to evaluate the quality of a connection. Each tells a slightly different story about what problems might exist and how they contribute to the lackluster experience you're having. Understanding each metric, how it impacts your network, and what you should expect to see can make finding the root cause of any problem a ton easier.
Here are the stats we often look for when evaluating a connection. These values are based on our own tests, IT industry quality standards, and a little bit of old-fashioned science and math. A passable network should have:
- Latency of 200ms or below, depending on the connection type and travel distance
- Packet loss below 5% within a 10-minute timeframe
- Jitter percentage below 15%
- Mean Opinion Score of 2.5 or higher
- A bandwidth speed of...let's talk about that one.
But that's just a C- network. If you're looking to go from so-so to stellar, you may need to dig a little deeper.
Latency
As much as we wish it was, data transmission isn't instant. It takes time to get data to and from locations, especially when they're separated by hundreds or thousands of miles. This travel time is called latency.
To be specific, latency (or ping) is the measure of how long it takes (in milliseconds) for one data packet to travel from your device to a destination and back.

Latency is one of the primary indicators of network performance quality. Most people desire a faster, more responsive experience, and latency is a major contributor. High latency can often result in laggy gameplay in online games (where what you're seeing onscreen doesn't seem to line up with what's happening in-game), constant stream buffering, and long page load times.
Knowing what makes a “good” latency is a bit more involved than just looking at a number. Latency is generally dictated by your physical distance and connection type. While we have a longer discussion on the topic, the short answer is you should expect to see 1ms of latency for every 60 miles between you and your endpoint, plus a base latency added by the type of connection you have:
- 0-10ms for T1
- 5-40ms for cable internet
- 10-70ms for DSL
- 100-220ms for dial-up
For example, on the average DSL connection, we would expect the round-trip time from New York to L.A. to be roughly 110ms (2,451 miles/60 miles per ms + 70ms for DSL). In general, we've found consistent latency above 200ms produces the laggy experience you're hoping to avoid.
Packet Loss
Files aren't transferred across your network fully formed. Instead, they are broken into easy-to-send chunks called packets. If too many of these packets fail to reach their destination, you're going to notice a problem.
The percentage of packet loss you experience over a given timeframe is another primary indicator of your network performance.

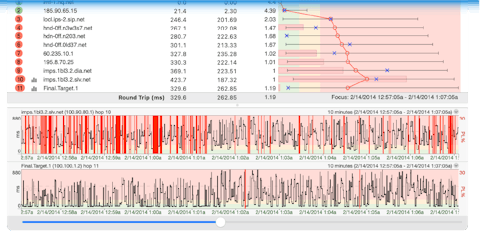
If a connection is suffering high packet loss, you're likely to experience unresponsive services, frequent disconnects, and recurring errors. On average, we consider a packet loss percentage of 2% or lower over a 10-minute timeframe to be an acceptable level. However, a good connection shouldn't see packet loss at all. If you're consistently experiencing packet loss of 5% or higher within a 10-minute timeframe, there is likely a problem.
When evaluating packet loss, it's important to remember some routers and firewalls are calibrated to ignore the type of packet used in many network tests. While one hop may experience 100% packet loss, it's not always indicative of your overall connection quality. Check out this knowledge base entry about packet loss to learn more.
Jitter
While consistently-high latency is a clear indicator of a problem, a wildly-fluctuating latency can also result in network quality issues.

The variance of latencies experienced over a given period of time is known as packet delay variation or jitter. The idea is fairly straightforward: When packets arrive at rapidly alternating speeds (fast, slow, fast, slow), the gaps between them create an inconsistent flow that negatively impacts real-time services, such as voice or video calls.
Jitter, which is measured in milliseconds, is calculated a few different ways. One method averages the deviation of latency samples and compares them to the average latency value across all samples to evaluate its impact.
Huh?
So, let's say you pinged a server five times and got these results (in this order — that matters): 136ms, 184ms, 115ms, 148ms, 125ms. To calculate the jitter, you'd start by finding the difference between the samples, so:
- 136 to 184, diff = 48
- 184 to 115, diff = 69
- 115 to 148, diff = 33
- 148 to 125, diff = 23
Next, you'd take the average of these differences, which is 43.25. The jitter on our server is currently 43.25 ms.
So...is that good? To find out, we divide our jitter value by the average of our latency samples:
- 43.25 / 141.6 (the average of our five samples) = 30.54%
A “stable” network typically experiences a jitter percentage of 15% or below (based on our observations). In the example above, the jitter is nearly double that, which means jitter may be the cause of any issues we're experiencing.
Mean Opinion Score
Given everything we just described, you may be asking, is there a number that just says whether my connection is good or not? Conveniently, there is! The Mean Opinion Score (or MOS) of a network is a straightforward one-to-five ranking of its overall quality.
Traditionally, MOS is calculated by polling individuals on how they would personally rate their experience using a specific connection (this surprisingly fascinating history of MOS can help explain the details). In the case of network testing tools like PingPlotter, MOS is approximated based on the latency, packet loss, and jitter of your current connection using a dedicated formula.
For most people, MOS ratings of 4 or higher are considered “good,” while anything below 2.5 is considered unacceptable.
What about bandwidth?
The “speed” of a connection is probably the biggest thing people care about when it comes to their network (other than it just working as it should). Everyone wants faster downloads, better-quality streams, and instantly-accessible webpages, which is often tied to network bandwidth. Bandwidth is the rate at which a volume of data transfers over time, usually measured in bits-per-second.
Why the scare quotes? Most people, including ISPs and other providers, love to talk about bandwidth and speed in the same sentence. However, bandwidth isn't actually about the speed of data's traversal — it's about the quantity of data transferred over a given time period, and understanding the difference between the two will save you a ton of headache when diagnosing a problem.
If your network connection was a highway, latency would be how long it takes one car to get from point A to point B under current road conditions, while bandwidth would be how many cars arrive at point B every second regardless of how fast they're going. If you're worried about things like in-game lag, it's less about how many cars you can push through and more about making sure your cars are the fastest.
Once again: Latency is speed, bandwidth is flow.
When solving a network problem, your bandwidth may be a symptom, but it's not a great metric for finding the source of your issue. This is because bandwidth is really only measurable at the endpoints of a connection, which limits its efficacy.
Let's go back to our data-highway. If there were a bunch of lane closures somewhere between A and B, we might notice fewer cars arriving at point B, but we wouldn't know much more than that. Is there a problem on the highway? Yep! Can you tell what it is? Nope! By using the metrics we mentioned above in combination with the right tool, however, we can dig into what the problem actually is.
Bandwidth matters for a lot of things, but it's not the best way to test your connection.
Light is green, connection's clean
So, is your connection in rock-solid shape? If not, it's time to do something about it. Grab a trusty network test tool and get pinging!
Once you're ready, we have step-by-step guides on troubleshooting your connection, identifying common problems, and more.

